


Script / Documentation
Welcome back to Just Facts Academy, where you learn how to research like a genius.
Let me remind you: You don’t need to be born an Einstein, to be a great researcher. You simply need to put in the effort and apply the 7 Standards of Credibility that we share in this video series.
Today’s lesson: Verification.
This 5-syllable word is really important for maintaining credibility and ensuring your paper’s or project’s success. So let’s define it, look at some examples of why it’s so important, and discuss how to use it in your own research.
As explained by Webster’s Dictionary, verification is the process of establishing “the truth, accuracy, or reality of” something.[1]
Basically, it means double checking. If a matter is really important and the stakes are high, you better make sure your research reflects reality. One of the best ways to do that is to use different sources, methodologies, and calculations to double check your work.
A little extra effort on this front can save a lot of embarrassment, money, and even lives.

Take, for example, the case of the Mars Climate Orbiter lost by NASA in 1999. Can you guess what caused this costly mission failure? NASA mixed up metric and English units when coding the software for the mission.[2] That’s right, NASA!
This shows that virtually anyone can make this kind of human error, and virtually anyone can correct it before it causes harm. Think about that before you blindly trust others—no matter how prestigious or smart they may be.
Now let’s look at another example. This involves a so-called fact checker, a government agency, and a scientific magazine that failed to verify something that an average high schooler could have checked.
Back in 2012, an organization called FactCheck.org published an article about the dangers of carbon dioxide. It said that “exposure to high levels of CO2 can cause ‘headaches’” based on a cut sheet from the Wisconsin Department of Health.[3] This cut sheet claims that CO2 levels of 2,000 to 5,000 parts-per-million are “associated with headaches….”[4] [5]
Having researched on this issue, Just Facts noticed these figures were much lower than other figures from studies published in academic journals.[6] [7] [8] So Just Facts wrote the Wisconsin Department of Health to see if they had any evidence to support their numbers.[9]
They did not—and Just Facts directed them to an extensive review of studies by the National Research Council that found CO2 did not cause headaches until levels rose to roughly 20,000 ppm.[10] Still, the Wisconsin Department of Health would not change its cut sheet.[11]
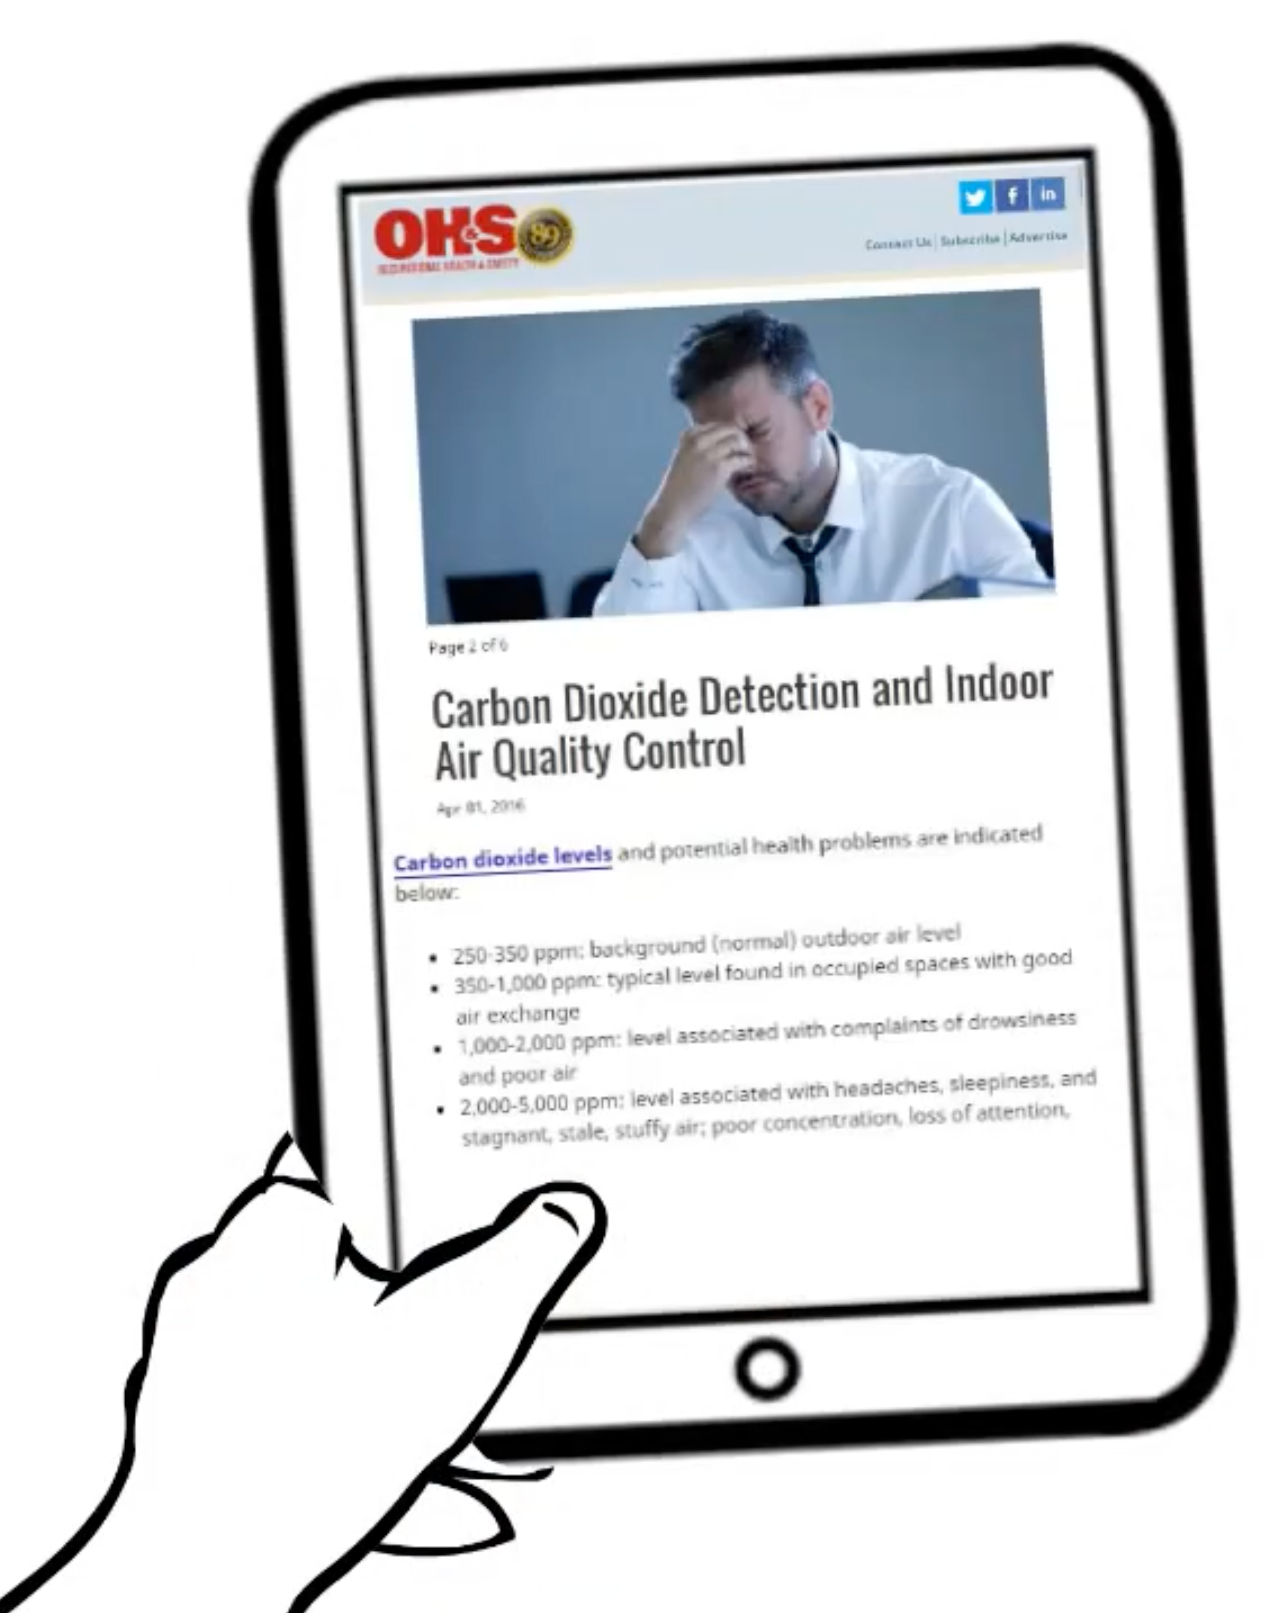
Fast forward to 2016 when the scientific magazine Occupational Health and Safety published an article about indoor air quality and carbon dioxide. Like Factcheck.org, it cited the cut sheet from Wisconsin Department of Health without verifying anything it had to say. Then it parroted the falsehood that CO2 levels of 2,000–5,000 ppm lead to headaches.[12]
So what’s the harm? Now, let’s fast forward to 2020 when the Covid-19 pandemic was raging, and government agencies like OSHA were telling workers to wear surgical masks while saying they don’t create “harmful carbon dioxide levels to the wearer.”[13]
And what is the average CO2 levels in such masks? Per a 2020 study in a scientific journal that specializes in air quality, CO2 levels in the breathing zone of these masks range from about:
- 2,000 ppm when doing office work,
- to 3,000 ppm when walking.[14]
In other words, they fall into the range that some scientific authorities wrongly said would cause headaches.
But headaches aside, OSHA should have verified its facts before claiming that the CO2 levels in surgical masks do no harm. That’s because the CO2 concentrations in these masks range from 2 to 3 times the government CO2 limits for classrooms in many nations.[15] [16] And at least two studies in science journals have found that such CO2 concentrations impair high-level brain functions like initiative, strategic thinking, and complex decision-making.[17] [18] [19]
Can you see how easily misinformation and confusion can spread? Everyone assumes that everyone else has verified the numbers, so nobody checks them.
And as the great scientist Joseph Lister wrote: “The weakness of our nature makes it often hard for” people to admit their errors, which is another good reason to avoid “rash and premature publication.”[20]
Bottom line: Check, double-check, and triple-check your work, especially if it’s important.
So, how can you implement the verification standard?
- Check your results by using different equations and different sources to make sure the answers are the same.

- If you find a major discrepancy between credible sources, dig until you find the cause of it. Remember Einstein’s insight that scientific greatness is less a matter of intelligence than character if you refuse to accept incomplete answers and persist in grappling with the most basic and difficult questions.[21]
- Be aware that you may find small discrepancies due to rounding and slight differences in methodology that can’t be resolved. If so, give preference to figures that are contrary to your viewpoint and use the most cautious plausible interpretations of the data. This shows that you are more serious about the truth than reinforcing your own views.
-
If you are working in a spreadsheet, which we recommend whenever possible, here are some clever and simple ways to verify your work:
- If you need a figure for only one time period, calculate it for all the available time periods and chart it. This will often reveal a hiccup in the data.
- Spot check your calculations with an online calculator. If you search online, you’ll find an enormous array of them.
- If you are calculating parts of a whole, add them up to make sure they sum to 100%. Realize that you might not obtain exactly 100% due to rounding errors, but if you get a result like this, it’s a good sign you have a problem:
|
Type of Tax |
Portion of Total |
|
Personal Income Taxes |
52% |
|
Social Insurance Taxes |
37% |
|
Corporate Income Taxes |
11% |
|
Excise Taxes |
3% |
|
Custom Duties |
1% |
|
Estate and Gift Taxes |
1% |
|
Check (Should Be 100% ± 1%) |
105% |
- And finally, step back from the results and ask yourself, “Does this make sense in the real world?” Researchers tend to get so wrapped up in the numbers that they miss obvious errors.
So, apply the Verification standard and the rest of Just Facts’ Standards of Credibility so you can research like a genius.
Footnotes
[1] Entry: “verify.” Merriam-Webster. Accessed June 16, 2021 at <www.merriam-webster.com>
“to establish the truth, accuracy, or reality of verify the claim”
[2] “Mars Climate Orbiter Mishap Investigation Board: Phase I Report.” NASA, November 10, 1999. <llis.nasa.gov>
Page 6:
The MCO [Mars Climate Orbiter] Mission objective was to orbit Mars as the first interplanetary weather satellite and provide a communications relay for the MPL [Mars Polar Lander] which is due to reach Mars in December 1999. The MCO was launched on December 11, 1998, and was lost sometime following the spacecraft’s entry into Mars occultation during the Mars Orbit Insertion (MOI) maneuver. The spacecraft’s carrier signal was last seen at approximately 09:04:52 UTC on Thursday, September 23, 1999.
The MCO MIB [Mishap Investigation Board] has determined that the root cause for the loss of the MCO spacecraft was the failure to use metric units in the coding of a ground software file, “Small Forces,” used in trajectory models. Specifically, thruster performance data in English units instead of metric units was used in the software application code titled SM_FORCES (small forces). A file called Angular Momentum Desaturation (AMD) contained the output data from the SM_FORCES software. The data in the AMD file was required to be in metric units per existing software interface documentation, and the trajectory modelers assumed the data was provided in metric units per the requirements.
Page 7:
The Board recognizes that mistakes occur on spacecraft projects. However, sufficient processes are usually in place on projects to catch these mistakes before they become critical to mission success. Unfortunately for MCO, the root cause was not caught by the processes in-place in the MCO project.
[3] Article: “Santorum’s Science.” By Lori Robertson. FactCheck.org, March 14, 2012. <www.factcheck.org>
Exposure to high levels of CO2 can cause “headaches, dizziness, restlessness, a tingling or pins or needles feeling, difficulty breathing, sweating, tiredness, increased heart rate, elevated blood pressure, coma, asphyxia to convulsions,” warns the Wisconsin Department of Health, “and even frostbite if exposed to dry ice,” which is solid CO2.
NOTE: For documentation of numerous falsehoods in this “fact check,” see Just Facts’ article, “FactCheck.org Misrepresents the Dangers of Carbon Dioxide.”
[4] Cut sheet: “Carbon Dioxide.” Wisconsin Department of Health and Family Services, Division of Public Health. Last revised 11/25/2005. Accessed March 15, 2012 at <www.dhs.wisconsin.gov>
Page 2:
The levels of CO2 in the air and potential health problems are:
• 250–350 ppm – background (normal) outdoor air level
• 350–1,000 ppm – typical level found in occupied spaces with good air exchange.
• 1,000–2,000 ppm – level associated with complaints of drowsiness and poor air.
• 2,000–5,000 ppm –level associated with headaches, sleepiness, and stagnant, stale, stuffy air. Poor concentration, loss of attention, increased heart rate and slight nausea may also be present.
• >5,000 ppm – Exposure may lead to serious oxygen deprivation resulting in permanent brain damage, coma and even death.
NOTE: The Wisconsin Department of Health took down the cut sheet and posted a slightly modified version of it on the “Health Effects” tab of this webpage. As of June 16, 2021, it was last revised on June 3, 2021 and reads:
The levels of CO2 in the air and potential health problems are:
• 400 ppm: average outdoor air level.
• 400–1,000 ppm: typical level found in occupied spaces with good air exchange.
• 1,000–2,000 ppm: level associated with complaints of drowsiness and poor air.
• 2,000–5,000 ppm: level associated with headaches, sleepiness, and stagnant, stale, stuffy air. Poor concentration, loss of attention, increased heart rate and slight nausea may also be present.
• 5,000 ppm: this indicates unusual air conditions where high levels of other gases could also be present. Toxicity or oxygen deprivation could occur. This is the permissible exposure limit for daily workplace exposures.
• 40,000 ppm: this level is immediately harmful due to oxygen deprivation.
[5] Paper: “Sealed Environments in Relation to Health and Disease.” By John H. Schulte. Archives of Environmental Health, March 1964. Pages 438–452. <www.tandfonline.com>
Page 442:
After several hours’ exposure to an atmosphere containing 2% carbon dioxide, subjects develop headache and dyspnea on mild exertion. At 3% carbon dioxide, the headache becomes progressively more severe, diffuse sweating occurs, and dyspnea will exist even at complete rest. At the 5% level, mental depression appears; and, when the carbon dioxide reaches a concentration of 6%, visual disturbances and tremors develop. Unconsciousness will usually occur as the level of carbon dioxide approximates 10%.
[6] Paper: “Sealed Environments in Relation to Health and Disease.” By John H. Schulte. Archives of Environmental Health, March 1964. Pages 438–452. <www.tandfonline.com>
Page 442:
After several hours’ exposure to an atmosphere containing 2% carbon dioxide, subjects develop headache and dyspnea on mild exertion. At 3% carbon dioxide, the headache becomes progressively more severe, diffuse sweating occurs, and dyspnea will exist even at complete rest. At the 5% level, mental depression appears; and, when the carbon dioxide reaches a concentration of 6%, visual disturbances and tremors develop. Unconsciousness will usually occur as the level of carbon dioxide approximates 10%.
[7] Paper: “Effect of Inspired Pco2 Up to 30 mm Hg on Response of Normal Man to Exercise.” By Stuart J. Menn, Richard D. Sinclair, and B.E. Welch. Journal of Applied Physiology, May 5, 1970. Pages 663–671. <www.gwern.net>
Page 665: “At 30 mm Hg Pco2 [39,000 ppm], six of the seven subjects experienced mild to moderate frontal headaches. These varied considerably in onset and duration and occurred usually in the final minutes of the exercise run and disappeared within 1 hr of exposure.”
Page 666: “The headaches occurred at the 30 Hg PIco2 level only, but they did not appear of disappear in any pattern. In no case were they severe enough to interfere with the subject’s performance of exercise.”
[8] Book: Emergency and Continuous Exposure Guidance Levels for Selected Submarine Contaminants. By the Subcommittee on Emergency and Continuous Exposure Guidance Levels for Selected Submarine Contaminants, Committee on Toxicology, National Research Council. National Academies Press, 2007. <www.nap.edu>
Page 49: “Thus, the bulk of the data indicate a no-observed-adverse-effect level (NOAEL) for CO2 of about 28,000 ppm on the basis of the findings on dyspnea [shortness of breath] and intercostal [between the ribs] pain.”
Page 50: “Thus, 20,000 ppm is an appropriate subchronic [duration of more than a year but less than a lifetime] NOAEL [no observed adverse effect level] for headaches.”
[9] Record of this correspondence: <www.justfacts.com>
[10] Book: Emergency and Continuous Exposure Guidance Levels for Selected Submarine Contaminants. By the Subcommittee on Emergency and Continuous Exposure Guidance Levels for Selected Submarine Contaminants, Committee on Toxicology, National Research Council. National Academies Press, 2007. <www.nap.edu>
Page 49: “Thus, the bulk of the data indicate a no-observed-adverse-effect level (NOAEL) for CO2 of about 28,000 ppm on the basis of the findings on dyspnea [shortness of breath] and intercostal [between the ribs] pain.”
Page 50: “Thus, 20,000 ppm is an appropriate subchronic [duration of more than a year but less than a lifetime] NOAEL [no observed adverse effect level] for headaches.”
[11] Record of this correspondence: <www.justfacts.com>
[12] Article: “Carbon Dioxide Detection and Indoor Air Quality Control.” By Steve Bonino. Occupational Health and Safety, April 1, 2016. <ohsonline.com>
[13] Newsletter: “Quick Takes.” Occupational Safety and Health Administration, August 17, 2020. <www.osha.gov>
COVID-19 Q&A
Does wearing a medical/surgical mask or cloth face covering cause unsafe oxygen levels or harmful carbon dioxide levels to the wearer?
No. Medical masks, including surgical masks, are routinely worn by healthcare workers throughout the day as part of their personal protective equipment ensembles and do not compromise their oxygen levels or cause carbon dioxide buildup. They are designed to be breathed through and can protect against respiratory droplets, which are typically much larger than tiny carbon dioxide particles. Consequently, most carbon dioxide particles will either go through the mask or escape along the mask’s loose-fitting perimeter. Some carbon dioxide might collect between the mask and the wearer’s face, but not at unsafe levels.
Like medical masks, cloth face coverings are loose-fitting with no seal and are designed to be breathed through. Workers may easily remove their medical masks or cloth face coverings periodically (and when not in close proximity with others) to eliminate any negligible buildup of carbon dioxide that might occur. Cloth face coverings and medical masks can help prevent the spread of potentially infectious respiratory droplets from the wearer to their co-workers, including when the wearer has COVID-19 and does not know it.
[14] Paper: “Effect of Wearing Face Masks on the Carbon Dioxide Concentration in the Breathing Zone.” By Otmar Geiss. Aerosol and Air Quality Research, October 7, 2020. <aaqr.org>
Page 1:
Lately, concern was expressed about the possibility that carbon dioxide could build up in the mask over time, causing medical issues related to the respiratory system. In this study, the carbon dioxide concentration in the breathing zone was measured while wearing a surgical mask, a KN95 and a cloth mask. For the surgical mask, the concentration was determined under different conditions (office work, slow walking, and fast walking). Measurements were made using a modified indoor air quality meter equipped with a nondispersive infrared (NDIR) CO2 sensor.
Page 5:
Doing office work and standing still on the treadmill each resulted in carbon dioxide concentrations of around 2200 ppm. A small increase of approximately 300 ppm could be observed when walking at a speed of 3 km h–1 (leisurely walking pace). Walking at a speed of 5 km h–1, which corresponds to medium activity with breathing through the mouth, resulted in an average carbon dioxide concentration of 2875 ppm. No differences were observed among the three types of tested face masks.
[15] Paper: “Effect of Wearing Face Masks on the Carbon Dioxide Concentration in the Breathing Zone.” By Otmar Geiss. Aerosol and Air Quality Research, October 7, 2020. <aaqr.org>
Page 1:
In this study, the carbon dioxide concentration in the breathing zone was measured while wearing a surgical mask, a KN95 and a cloth mask. For the surgical mask, the concentration was determined under different conditions (office work, slow walking, and fast walking). …
The average carbon dioxide concentration inhaled was, however, far higher than the limit of 0.1% [1,000 ppm] of indoor carbon dioxide concentration in many countries.
Page 5:
Doing office work and standing still on the treadmill each resulted in carbon dioxide concentrations of around 2200 ppm. A small increase of approximately 300 ppm could be observed when walking at a speed of 3 km h–1 (leisurely walking pace). Walking at a speed of 5 km h–1, which corresponds to medium activity with breathing through the mouth, resulted in an average carbon dioxide concentration of 2875 ppm. No differences were observed among the three types of tested face masks.
[16] Appendix: “Typical Indoor Air Pollutants.” U.S. Environmental Protection Agency, August 14, 2014. <www.epa.gov>
Page 35: “ASHRAE [American Society of Heating, Refrigerating and Air-Conditioning Engineers] Standard 62-2001 recommends 700 ppm above the outdoor concentration as the upper limit for occupied classrooms (usually around 1,000 ppm).”
[17] Paper: “Is CO2 an Indoor Pollutant? Direct Effects of Low-to-Moderate CO2 Concentrations on Human Decision-Making Performance.” By Usha Satish and others. Environmental Health Perspectives, December 1, 2012. <ehp.niehs.nih.gov>
Relative to 600 ppm, at 1,000 ppm CO2, moderate and statistically significant decrements occurred in six of nine scales of decision-making performance. At 2,500 ppm, large and statistically significant reductions occurred in seven scales of decision-making performance (raw score ratios, 0.06–0.56), but performance on the focused activity scale increased.
… Prior research has documented direct health effects of CO2 on humans, but only at concentrations much higher than those found in normal indoor settings. CO2 concentrations > 20,000 ppm cause deepened breathing; 40,000 ppm increases respiration markedly; 100,000 ppm causes visual disturbances and tremors and has been associated with loss of consciousness; and 250,000 ppm CO2 (a 25% concentration) can cause death (Lipsett et al. 1994). Maximum recommended occupational exposure limits for an 8-hr workday are 5,000 ppm as a time-weighted average, for the Occupational Safety and Health Administration (OSHA 2012) and the American Conference of Government Industrial Hygienists (ACGIH 2011). …
For seven of nine scales of decision-making performance (basic activity, applied activity, task orientation, initiative, information usage, breadth of approach, and basic strategy), mean raw scores showed a consistently monotonic decrease with increasing CO2 concentrations, with all overall p-values < 0.001 (Table 2). … For these seven scales, compared with mean raw scores at 600 ppm CO2, mean raw scores at 1,000 ppm CO2 were 11–23% lower, and at 2,500 ppm CO2 were 44–94% lower. …
… At 1,000 ppm CO2 relative to 600 ppm, percentile ranks were moderately diminished at most. However, at 2,500 ppm CO2, percentile ranks for five performance scales decreased to levels associated with marginal or dysfunctional performance. …
Performance for six of nine decision-making measures decreased moderately but significantly at 1,000 ppm relative to the baseline of 600 ppm, and seven decreased substantially at 2,500 ppm. For an eighth scale, “information search,” no significant differences were seen across conditions. In contrast to other scales, an inverse pattern was seen for “focused activity,” with the highest level of focus obtained at 2,500 ppm and the lowest at 600 ppm. …
We do not have hypotheses to explain why inhaling moderately elevated CO2, with the expected resulting increases in respiration, heart rate, and cardiac output to stabilize PaCO2, would affect decision-making performance. …
… Although we conclude that the causality of the observed effects is clear, the ability to generalize from this group of college/university students to others is uncertain. Effects of CO2 between 600 and 1,000 ppm and between 1,000 and 2,500 ppm, and effects for longer and shorter periods of time are also uncertain. The strength of the effects seen at 2,500 ppm CO2 is so large for some metrics as to almost defy credibility, although it is possible that such effects occur without recognition in daily life. Replication of these study findings, including use of other measures of complex cognitive functioning and measures of physiologic response such as respiration and heart rate, is needed before definitive conclusions are drawn.
[18] Paper: “Airplane Pilot Flight Performance on 21 Maneuvers in a Flight Simulator Under Varying Carbon Dioxide Concentrations.” By Joseph G. Allen and others. Nature, August 8, 2018. <www.nature.com>
We recruited 30 active commercial airline pilots to fly three 3-h [hour] flight segments in an FAA-approved flight simulator with each segment at a different CO2 concentration on the flight deck (700, 1500, 2500 ppm). … The pilots performed a range of predefined maneuvers of varying difficulty without the aid of autopilot, and were assessed by a FAA Designated Pilot Examiner according to FAA Practical Test Standards. Pilots and the Examiner were blinded to test conditions and the order of exposures was randomized. …
… For all difficulty categories, passing rates were lowest under the high CO2 condition relative to the low condition, and a dose–response effect was observed for increasing difficulty maneuvers. … In multivariate modeling accounting for the repeat testing of pilots (Table 4), the odds of passing a maneuver was 1.69 (95% CI: 1.11–2.55) times larger when pilots were exposed to 700 ppm compared to 2500 ppm, controlling for maneuver difficulty, Examiner and order of maneuvers. …
… The effect of CO2 on passing rates became more pronounced the longer the pilots were in the simulator, with the dose–response between CO2 and passing rate becoming apparent after 40 min of exposure (Fig. 3). …
… The divergence on the impacts of indoor CO2 exposure on cognitive function may be related to the complexity of tasks performed. The testing by Zhang et al. on cognitive function is based on simple or common cognitive tasks….
… Passing rates were twice as high at 700 ppm and 1500 ppm during a takeoff with an engine fire than at 2500 ppm, and four times as high at 700 ppm during a RTO [rejected takeoff] than at 2500 ppm.
[19] In contrast to the studies above, a study published by the journal Indoor Air in 2017 found “no statistically significant effects” on the “cognitive performance” of 25 people exposed to 3,000 ppm of CO2 for 255 minutes. However, locked behind a $59 paywall, the paper reveals that there were significant effects on some measures of cognitive performance, even though none of the tests were very demanding:
-
“Among the many tasks examining the impact of exposure conditions on the performance of subjects, there were only a few for which conditions had a significant effect on performance.” These included:
- the speed and the error rates during simple addition (adding “five two-digit numbers printed in the same vertical column”).
- redirection (looking at images of a person facing in different directions with object in his hand and correctly identifying whether he is holding the object in his left or right hand).
- number linking (tracing “a line as quickly and accurately as possible through a series of two-digit numbers scattered randomly over a page, essentially rank-ordering them in sequence”).
- The cognitive tests used for the study resembled “office work,” while other studies (including the ones above) used “more complex” tests that impose “considerable cognitive load” and require more brainpower.
[20] Book: Lord Lister (3rd Edition). By Sir Rickman John Godlee. Oxford University Press, 1924.
Page 390:
August 1876 graduation address at the University of Edinburgh …
When I was a little boy I used to imagine that prejudice was a thing peculiar to some individuals. But, alas! I have since learned that we are all under its influence. But let us ever contend against it; and remembering that the glorious truth is always present, let us strive patiently and humbly to discover it. And considering that the weakness of our nature makes it often hard for men to recant an error to which they have once committed themselves, you will see an additional reason against rash and premature publication.
[21] Book: Einstein in America: The Scientist’s Conscience in the Age of Hitler and Hiroshima. By Jamie Sayen. Crown Publishers, 1985.
Book jacket:
Here too is a portrait of the private Einstein, as revealed by the testimony of those who knew him best: his daughter, Margot; his close political ally and friend, Otto Nathan; his secretary, Helen Dukas; his fellow physicist, Valentine Bargmann, who often served as his translator; as well as many other friends and neighbors.
Page 86:
Einstein scorned the popular notion that he was the greatest scientist. He liked to say that God had given him a mulelike stubbornness to stick with a difficult problem and the intuitive powers to conceptualize complex hypothetical situations in his mind. For Valentine and Sonja Bargmann he once inscribed the following ditty in a book of essays about his science and philosophy:
Eines sieht man klar darin (One can clear see herein)
Was vermag der Eigensinn.13 (Just what stubbornness can win.)
… Scientific greatness, he was fond of saying, is less a matter of intelligence than character, whereby the scientist refuses to compromise or accept incomplete answers and persists in grappling the most basic and difficult questions.
13 Inscription by Einstein for the Bargmann’s copy of Albert Einstein: Philosopher-Scientist….